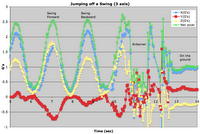
So what happens when you let a physicist loose with an acceleration sensor? They find something to measure of course! I’ve been fortunate enough to test several sensors, including the HiTechnic acceleration sensor. This is a 3-axis accelerometer that can register up to 2.5 G’s along each axis with a fairly high resolution. I used it for a couple of “standard” robotics-type applications, like vehicles that try to roll up hill, etc., but what originally drew my attention to the RCX, years ago, was its ability to function as a cheap datalogger. So I wrote up a simple NXT-G program that allows me to log data from the sensor to the NXT file system on command: the result is a compact and very rugged datalogger, suitable for measuring accelerations almost anywhere. As an example, I duct taped the sensor to my tailbone, and went out back to play on the swings. The graph shows the results.  The red line is the side-to-side acceleration (minimal, as I was trying to swing in a straight line), while the blue and yellow traces represent accelerations in the other two directions. The vector sum of all these is the green trace, showing my peak acceleration is slightly more than 2.5 G’s at the bottom of my arc. Notice I exited the swing by jumping off (hey, if you can’t have fun…), resulting in a very low-acceleration section of the graph.
Why bother? Two reasons: first, this is something I’ve wanted to do, and points out another really fun use for the NXT – teaching science. Imagine taking this to “physics day” at a theme park, and recording the accelerations on a roller coaster or some other thrill ride. “Mission Space” at Disney? “Demon Drop” at Cedar Point? Or just playing on the local playground? There are some wonderful possibilities here (I know, for instance, what the acceleration profile looks like for my car now).
Secondly, this is another good example of the community making all this possible. To get that graph, I had to use a sensor (to get the data) and extra-long cable (to allow for movement) from HiTechnic, a custom NXT-G block (to get the data out of the sensor) built by Steve Hassenplug, using the beta-version of the LabVIEW toolkit (to allow building and integrating such custom solutions), and of course the NXT brick from LEGO. I had the idea (and have for a while), but implementing that idea took contributions from at least four different directions.
 OK, teachers, researchers, and amateur scientists… what will you datalog? Anybody want to email me some interesting data?
--
Brian Davis
 The red line is the side-to-side acceleration (minimal, as I was trying to swing in a straight line), while the blue and yellow traces represent accelerations in the other two directions. The vector sum of all these is the green trace, showing my peak acceleration is slightly more than 2.5 G’s at the bottom of my arc. Notice I exited the swing by jumping off (hey, if you can’t have fun…), resulting in a very low-acceleration section of the graph.
Why bother? Two reasons: first, this is something I’ve wanted to do, and points out another really fun use for the NXT – teaching science. Imagine taking this to “physics day” at a theme park, and recording the accelerations on a roller coaster or some other thrill ride. “Mission Space” at Disney? “Demon Drop” at Cedar Point? Or just playing on the local playground? There are some wonderful possibilities here (I know, for instance, what the acceleration profile looks like for my car now).
Secondly, this is another good example of the community making all this possible. To get that graph, I had to use a sensor (to get the data) and extra-long cable (to allow for movement) from HiTechnic, a custom NXT-G block (to get the data out of the sensor) built by Steve Hassenplug, using the beta-version of the LabVIEW toolkit (to allow building and integrating such custom solutions), and of course the NXT brick from LEGO. I had the idea (and have for a while), but implementing that idea took contributions from at least four different directions.
 OK, teachers, researchers, and amateur scientists… what will you datalog? Anybody want to email me some interesting data?
--
Brian Davis